Why I Created This Goal Tracker
Every start to a new year my wife and I have a tradition of going out to eat (without the kids) and discussing our goals for the current year. Typically, I just make a checklist in my OneNote App, which has worked fairly well in years past. However, I noticed there wasn’t much accountability or urgency coming through my basic checklist. This got me thinking over my Christmas break about a more interactive way I could track the goals I set for myself.
In this post, I’ll walk you through what I created and touch on some of the ways I used Excel’s features to make it a bit more interactive than a simple checklist. If that doesn’t appeal to you, you are more than welcome to just download the Excel template and start using it.
Free Article Example File Download
If you would like to download the example file used within this article please click the below button to gain access to my Example Files download page. As with all my downloadable files here on TheSpreadsheetGuru, you need to be a member of my Excel Tips Newsletter. You can get signed up quickly by clicking the button below.
⭳ Download Example FileOnly my newsletter subscribers get access to example files.
Click the Download button above to quickly sign-up for free!
Two Goal Tracking Formats
I created two ways to track goals in this tracker to allow more flexibility for how I would like to track progress.
Simple Checklist Tab
This version of the tracker is a "Done"/"Not Done" listing where you can split your goals up into as many as six categories or themes. Each category will calculate the percentage of completion based on the number of lines filled out that are checked off. The thought is you would check off your goals as you complete them throughout the year. If there is a goal you weren’t able to accomplish, you mark it with an “X”.
Itemized Percentage Progress List Tab
This version of the tracker is a bit more granular. It has the same basic premise where you can split your goals up into categories and the overall percentage of completion is calculated. The difference in this version is you can update the percentage of completion for each of your goals as you work towards them.
How These Were Built Using Excel
There were some pretty neat techniques I was able to utilize while building this tracker out. Let’s go over a few aspects that will not only help you understand how the underlying spreadsheet works, but might lend themselves to finding use in other spreadsheets you build in the future.
The Green Bumpers?
So what’s up with the green cells at the bottom of each list? I ended up having to come up with a “creative” solution for a seemingly annoying/buggy design of Excel.
With any template you create, you have to account for users wanting/needing to insert delete rows and how that might impact your spreadsheet. We’ll discuss how the formulas were set up for this in the next section, but another factor is ensuring the formatting carries into new rows properly.
You’ll notice in my list, I have a couple of formatting features including font color, data validation, and border color. Excel at this time has this oddity where if you insert a row, all the formatting from the above row carries down into the new row…..EXCEPT for borders! The border formats actually carry up from the row below. So after sending a nastygram off to Microsoft, I came up with the solution of incorporating this green bumper-looking thing.
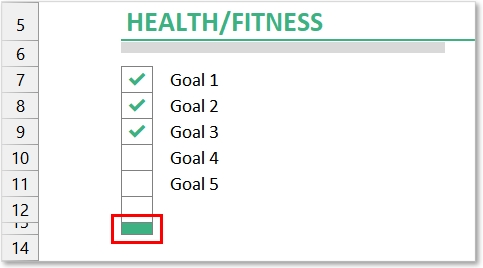
This actually came out pretty nice in the end as it gives a good visual indicator as to where the user needs to insert their new rows and solved my formatting carryover issue.
Calculating Progress Percentage
I’m only going to cover the percentage formula in one of the tabs as they are both similar in concept, but this formula is a little more interesting than the other.
So the template needed a formula that averaged the progress of filled-out line items. This means we have to account for blanks and ensure they are not included in our average calculation.
=IFERROR(COUNTIFS(G7:G13,"✔")/COUNTA(I7:I13),"")
At its base, we are counting how many checkmark icons are selected in the list and using the COUNTA function to see how many rows are filled out (not blank/empty).
Notice how the search ranges go all the way down to the green bumper. When you are setting up formulas in spreadsheets that will likely have inserted rows in them, you always need to set it up so that the search range overextends and will always pick up new rows (if you are not using a Table object).
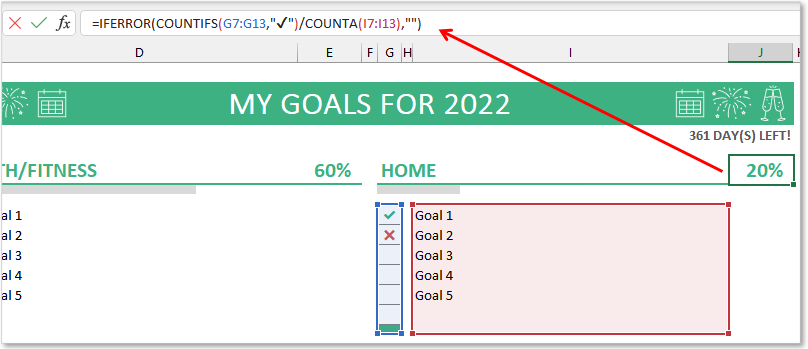
Finally, I had to wrap the formula with an IFERROR function because if the section is completely empty (ie not being used by the user) we get a dividing by zero situation which gives us a nasty looking error value.
Setting Up Grey Progress Bar
This was actually a last-minute addition to the tracker. I originally thought I would use a donut chart to display the overall progress of each group, but I think the bar chart I ended up using gives you the same “progress” effect however is more subtle than what the Donut chart would have been on the sheet.
So how did I get an Excel chart to essentially just be a grey bar? Look through the below slideshow to see how I made the transformation (note, I left the grey chart border in so you could see better, but ultimately that gets removed as well).
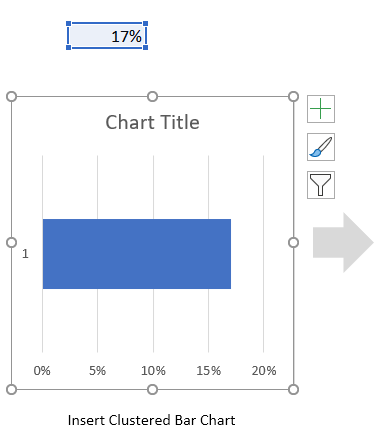
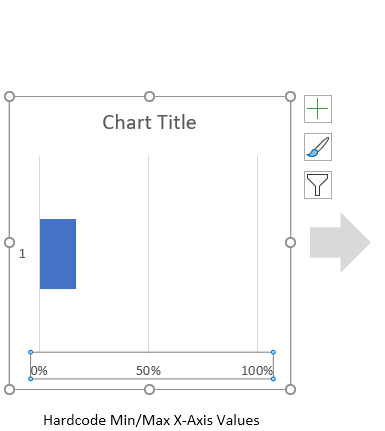
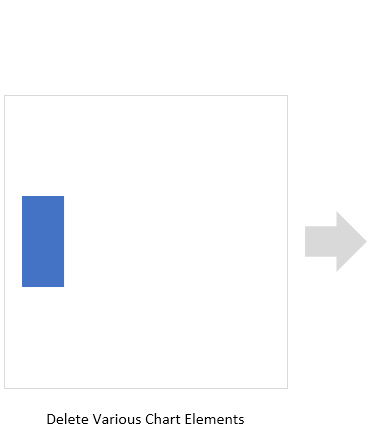
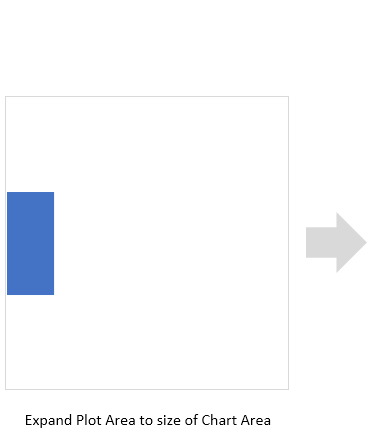
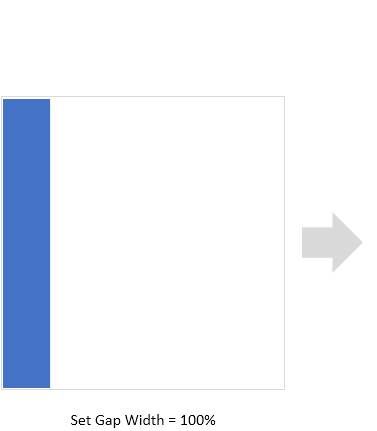
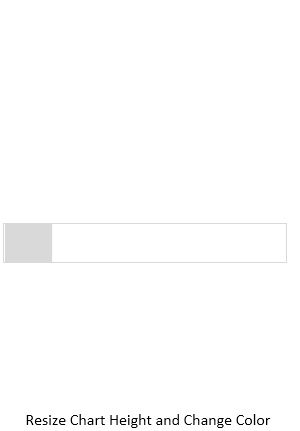
Once I had my grey bar made, I ensured the chart length was the same width as my green Category Header underline and positioned it directly under the border.

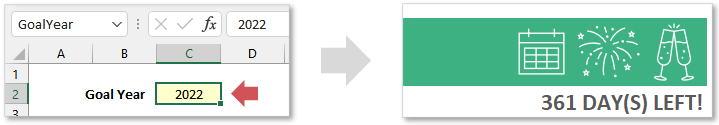
Displaying Days Left
I used the following formula to calculate how many days are left until the year has finished:
=IFERROR(DATEDIF(TODAY(),DATE(GoalYear,12,31),"d"),0) & " DAY(S) LEFT!"
DATEDIF( ) Function
The bulk of the work is being done by the DATEDIF function which allows you to plug in two different dates and the function determines the difference between them. I made the function’s inputs dynamic by using the TODAY function to pull the current date, and then I create a date for the end of the year (Dec 31) utilizing the Named Range (GoalYear) I set up as a user input to get the current year. The final input to this function is to tell it what interval I want my answer in (years, months, days). By using the “d”, I indicate I want my result in days.
IFERROR( ) Function
An IFERROR function needs to be wrapped around the DATEDIF function to handle an error result if the current date is past the goal year. This will happen after years of using this template as you go back to older files and review your goals and the progress you made. Since we are utilizing the TODAY function, we have to account for all possibilities.
Adding Cool Icons
We are SO lucky with the current versions of Excel. Microsoft is paying big bucks to provide us all with free graphics and icons directly within the Office programs. Just look at all the amazing content available in the Icon Browser:
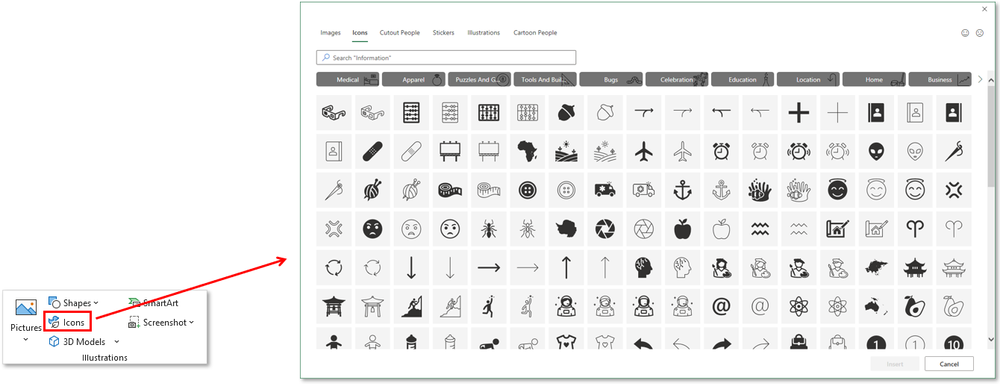
As of this writing M365 has a very large library of icons with two different styles:
Solid
Thin
At the moment, the Thin icons are in-style. You can tell because Microsoft recently released Windows 11 and all the Microsoft Office iconography was updated to have very thin (1px) borders with very minimal color fills. So to align with current “modern” style preferences, I included the thin versions of a few icons that aligned with the New Year goal setting theme.
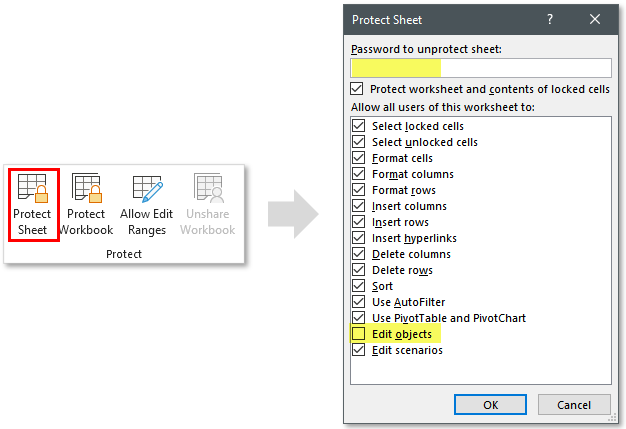
Preventing Users From Selecting Objects
Lastly, since I added some objects (icons, charts) that are really meant to sit in the background and be only viewable, I wanted to prevent users from accidentally selecting them while interacting with the tracker. We can obtain this by using the Protection options, but we have to be careful about how we set it up.
First, I needed to select all cells on the spreadsheet and put them into an unlocked state. If you don’t know how to do this, here is a quick GIF to walk you through the steps:
Next we need to setup the spreadsheet protection. Notice how I wrote “spreadsheet protection” and not “password protection”. With template I like to protect sheets without a password added, so that users can easily unlock it and fiddle around if they so choose.
The settings for the desired protection I wanted was pretty straightforward. I wanted the user to be able to do anything they want accept select the charts and icons that I added to the spreadsheet. Anything that sits on top of the spreadsheet (not embedded in a cell) is referred to as an object. So the setup is simply checking everything in the Protect Sheet dialog box accept Edit Objects.
I Hope This Helped!
Alright, I think I touched on all the interesting stuff that I worked through while building this. Hopefully, you gained some insights into what I think about when I’m putting together a template for the public. Well put together Templates are arguably one of the hardest things to develop in Excel because your end users can literally do a gazillion things inside Excel that could potentially mess up your creation. You have to be great at anticipating the interactions and needs of your users while also balancing how much freedom you should give your users.
If you have any questions about the techniques used in the template or suggestions on how to improve it, please let me know in the comments section below.
Free Article Example File Download
If you would like to download the example file used within this article please click the below button to gain access to my Example Files download page. As with all my downloadable files here on TheSpreadsheetGuru, you need to be a member of my Excel Tips Newsletter. You can get signed up quickly by clicking the button below.
⭳ Download Example FileOnly my newsletter subscribers get access to example files.
Click the Download button above to quickly sign-up for free!

About The Author
Hey there! I’m Chris and I run TheSpreadsheetGuru website in my spare time. By day, I’m actually a finance professional who relies on Microsoft Excel quite heavily in the corporate world. I love taking the things I learn in the “real world” and sharing them with everyone here on this site so that you too can become a spreadsheet guru at your company.
Through my years in the corporate world, I’ve been able to pick up on opportunities to make working with Excel better and have built a variety of Excel add-ins, from inserting tickmark symbols to automating copy/pasting from Excel to PowerPoint. If you’d like to keep up to date with the latest Excel news and directly get emailed the most meaningful Excel tips I’ve learned over the years, you can sign up for my free newsletters. I hope I was able to provide you some value today and hope to see you back here soon! - Chris